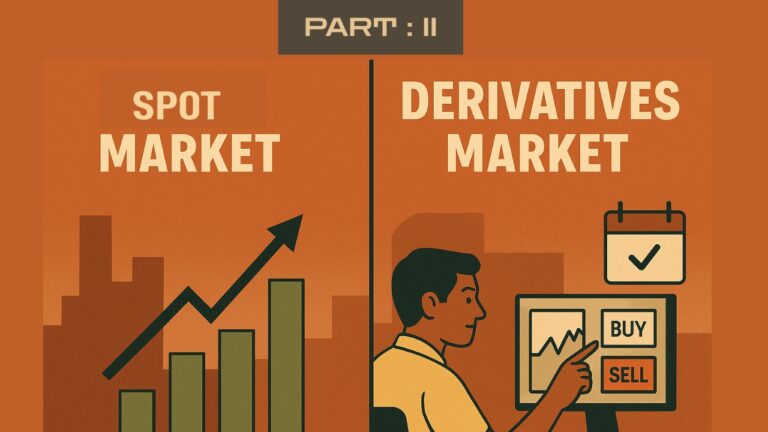
What is the Spot/Cash Market? Welcome to the Bazaar: Let’s imagine you’re walking through a street bazaar. You see tomatoes. ₹20 per kilo. You pay cash. You take the tomatoes home. Boom. That’s the...
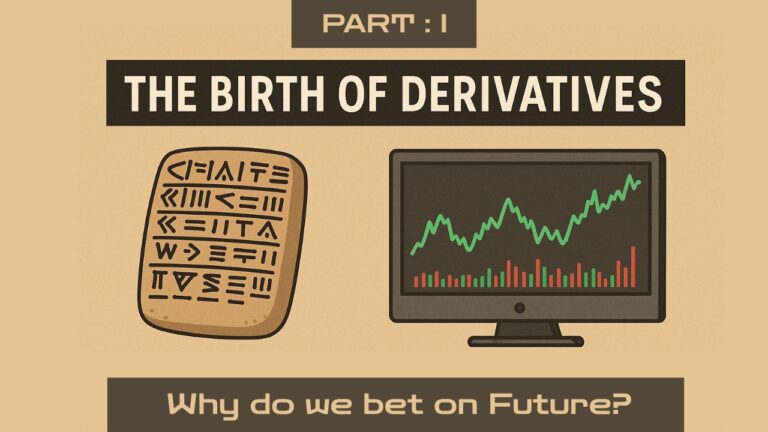
The Birth of Derivatives From Clay Tablets to Trading Terminals: Why We Bet on the Future Let’s rewind — way, way back. Not to the 2008 crisis, or even the Wall Street boom of the ’80s. We’re talking...
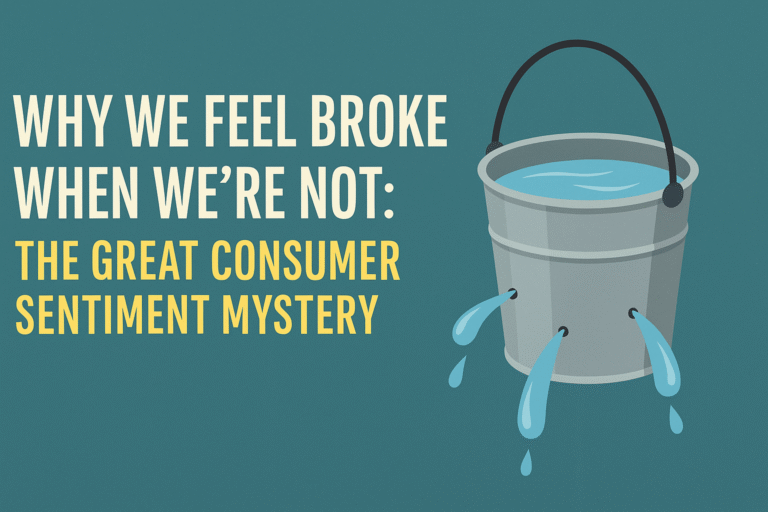
The economy says we’re thriving. We say we’re struggling. Who’s right? Everyone — and no one. Let’s crack a strange case. Since 2017, the RBI’s Consumer Confidence Index has hovered below 100 — a...
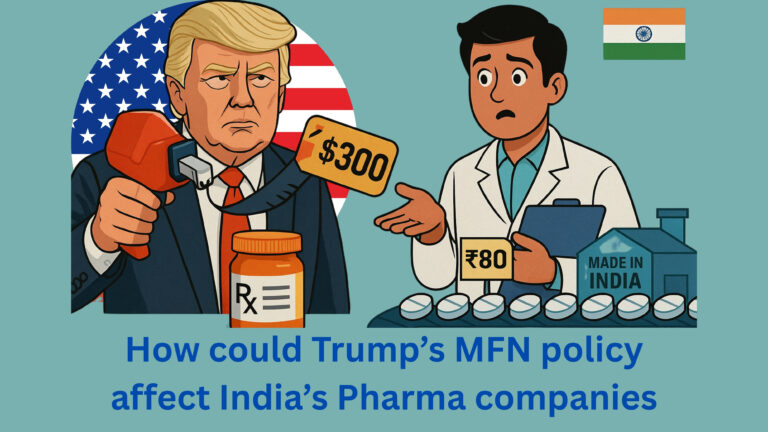
Picture This: You’re dining at a global buffet. The chef charges: Which is, Kind ‘a fair because Indians have less money to pay than the Americans and Canadians. Now an American Uncle storms in...
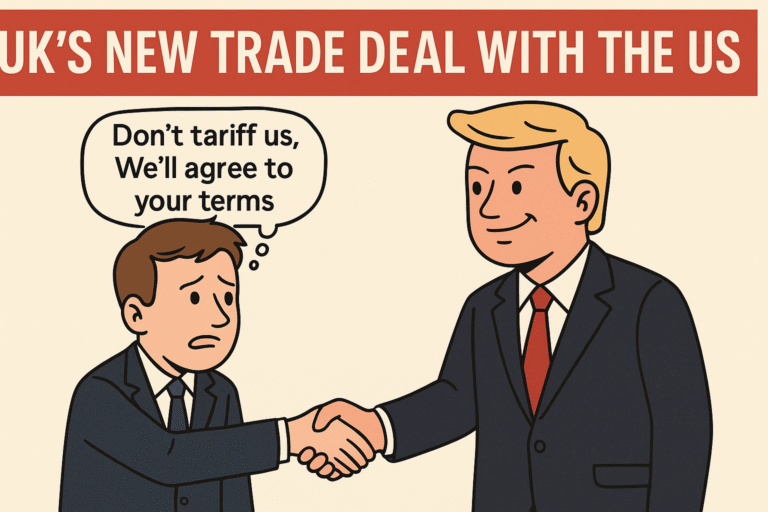
The UK and US just made a trade deal so vague, a lawyer joked it had “about the same legal weight as a napkin.” No, seriously. So what is this deal? Well… it’s barely a deal. More like a...
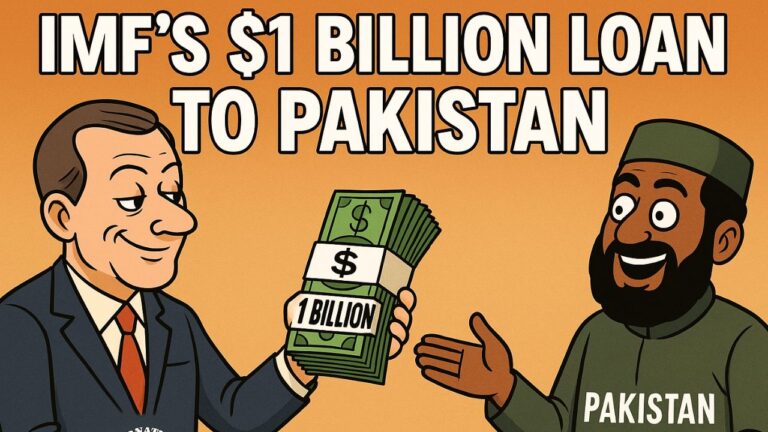
In a move that could only be described as unbelievably generous, the International Monetary Fund (IMF) has approved a $1 billion loan to Pakistan, part of its $7 billion bailout package. Never mind...
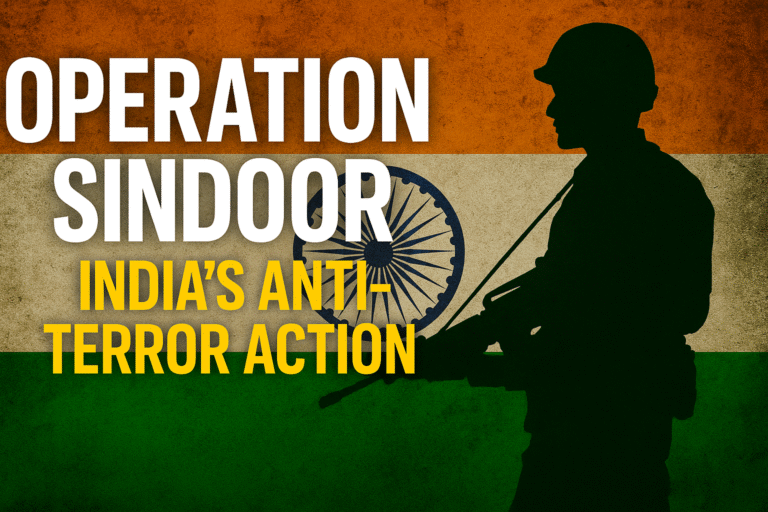
The Indian armed forces initiated ‘Operation Sindoor’ targeting terrorist infrastructure. The operation took place in Pakistan and Pakistan-occupied Jammu and Kashmir. This was in response...
Imagine a giant marketplace—buzzing stalls, creativity everywhere, fresh ideas sparking at every turn. That’s WAVES Bazaar in a nutshell. But it’s not just a market. It’s a playground for...
Every summer, India doesn’t just watch cricket. It lives it. The IPL isn’t just a tournament—it’s a nationwide event. And for brands? It’s a goldmine. In 2024, a 10-second IPL ad spot went for up to...